Mutual Fund Dashboard is designed to enhance clients Investment and Assets Under Management (AUM) with paid interest. It is to analyse effectiveness with large number of branches that carrying out clients having different type of investment and transaction based on time. It helps stock trader to track investment and client’s overall details by getting right metrics anytime, anywhere. Mutual fund allows you to discover why your customers and their investments are dropping in some areas. The dashboards can help you filter out data at multiple levels. For example, one can see client’s performance by investment time, fund strategy to increase clients by city and/or branch.

Ready to use SharePoint Web Parts, Power Apps,
Power BI and Microsoft Teams Solutions
Regulatory and Industry specific compliances
made easy with our solutions
Mutual Fund Analytics for Investment Management Organization
Mutual fund dashboard provides following advantages to organization and stock traders:
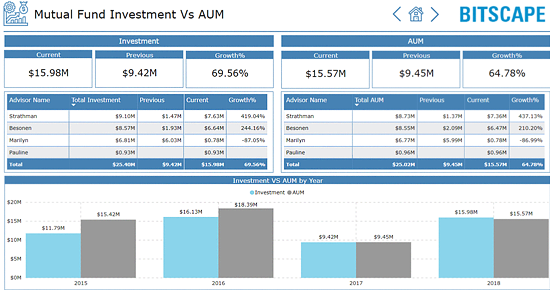
- Get analysis of time-based investment vs AUM and paid interest of clients, including running total with advisor
- Identify investment vs AUM running total and average CAGR with absolute return
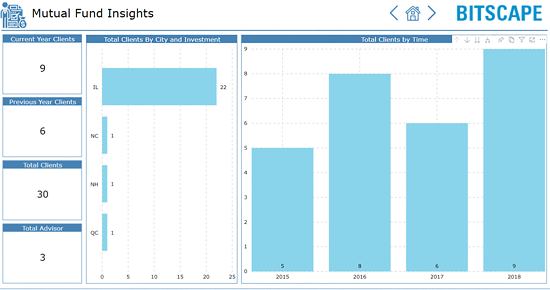
- Examine city and time wise clients and their investment
- Get understanding of state and district wise highest depositors and total ledger with registered and pending numbers
- Analyse KYC completed client’s details
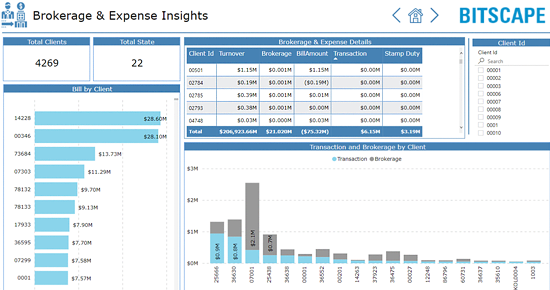
- Understanding of state and client wise transaction and brokerage with bill amount and other charges
- Analyse top-bottom brokerage and expense by clients with highest transaction, clients with highest turnover and highest paid brokerage
- Identify items available quantity and total bags detail in city and warehouse