Product Revenue Analytics dashboard design to monitors target vs revenue insights. It delivers a solution to provide holistic insights to visualize precise revenue performance with detailed revenue metrics. The Product Revenue Analytics dashboard demonstrates powerful ways of interacting with your data and developed key oriented metrics with meaningful details.

Ready to use SharePoint Web Parts, Power Apps,
Power BI and Microsoft Teams Solutions
Regulatory and Industry specific compliances
made easy with our solutions
Product Revenue Analytics
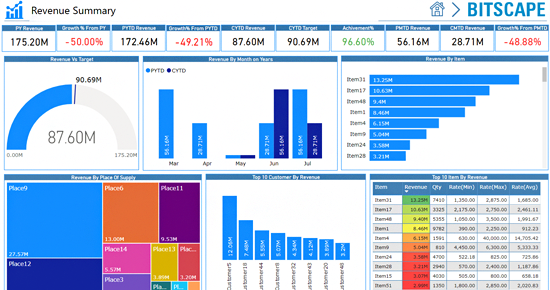
1. Revenue Summary
- Revenue summary displays overall details of all report pages. It Examine profitability of revenue vs target. It shows trends among Time, customer, Supply place and items.
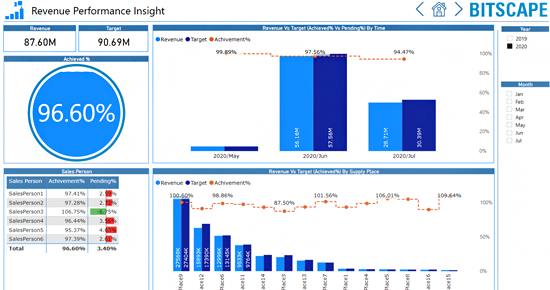
2. Revenue Performance Insight
- Analyse revenue vs target and achieved % by time, supply place and by salesperson
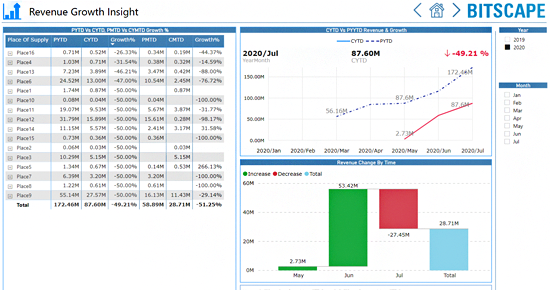
3. Revenue Growth Insight
- Get analysis of the revenue vs target metrics at an overall and detailed levels. It analyses revenue forecast and growth insights by supply place, salesperson, and customers
4. Salesperson Insights
- Examine overall details of salesperson, what are the revenue by time, and what are the top and bottom salespersons
5. Items Insights
- Monitors revenue by items, top and bottom items by revenue and time-based item wise revenue
6. Supply Place Insights
- It allows you to view revenue, change and growth % by place supply, also used to view time wise supply place and their revenue. It shows top and bottom place of supply by revenue
7. Customers Insights
- Analyze revenue, change and growth % by customer, also shows top customers by time
8. Customer Performance Insights
- Monitors customer performance, what are the positive customers that having good performance in last month as well as customers left and not purchase and details of new customers with their revenue
9. Invoice Insights
- It analyzes customer wise revenue, customer wise no of items to purchase and invoice details. It displays Invoice by revenue and no of items
10. Top/Bottom Performing
- It displays top customers, items, and supply by revenue. User redirects on bottom page by clicking on “Click to Bottom" button. User can view no of top or bottom views by clicking on “Top Count" filters